Recently, YouTube added the ability to do A/B testing on video titles. And you can combine that with A/B testing on thumbnails. So you can test just thumbnails, just titles, or even test various titles combined with various thumbnails to test each combination and compare them.
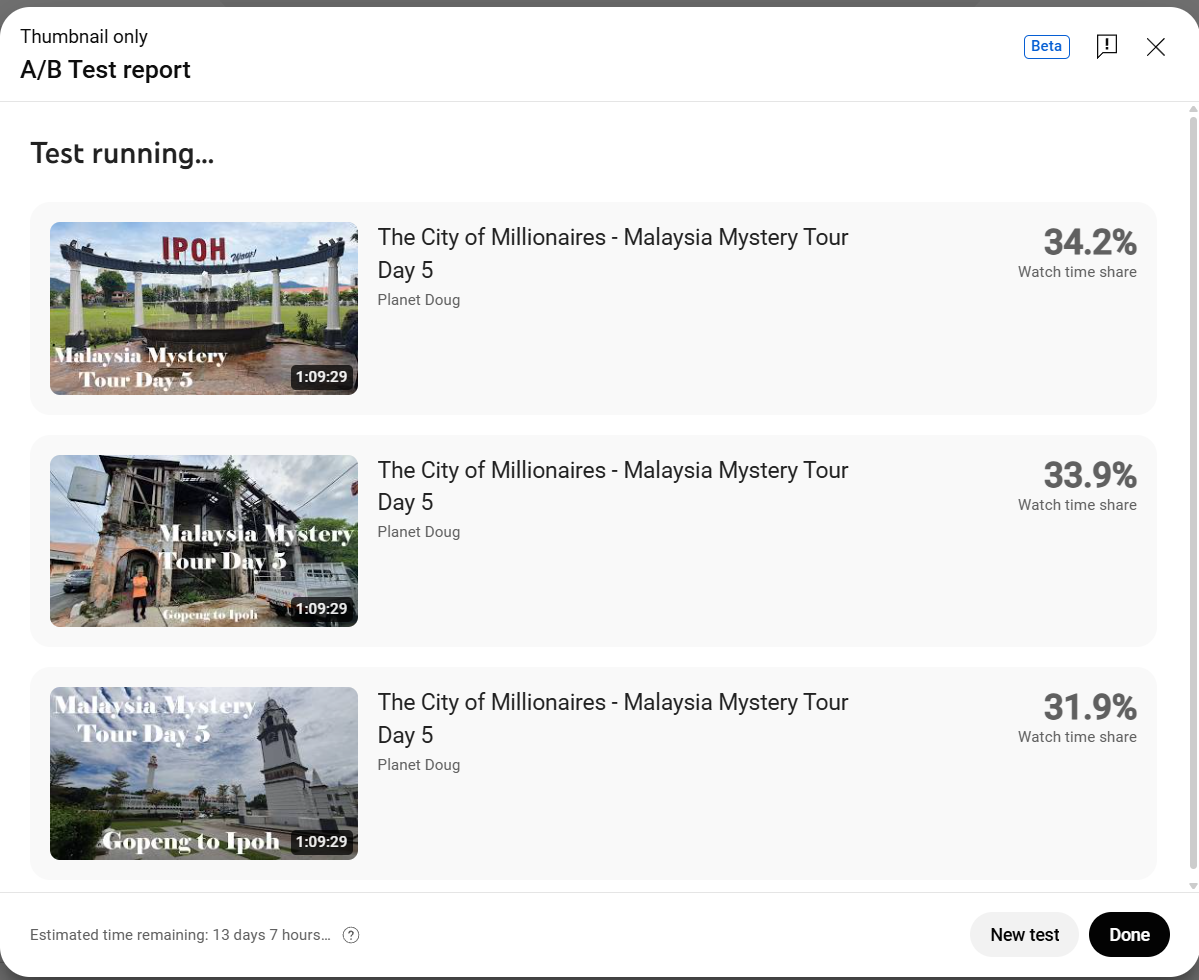
When they added the ability to test video titles, it reminded me of the possibility to test thumbnails, so just for fun I did a test with my Ipoh video from the Mystery Tour. You can see the results in the graphic above and the list below.
Thumbnail 1 – 34.2%
Thumbnail 2 – 33.9%
Thumbnail 3 – 31.9%
As you can see, there isn’t much difference between the three thumbnails. According to those numbers, it wouldn’t have mattered which thumbnail I used. All three are largely the same. I don’t really know what this means.
It’s important to note that these percentages are based on share of Watch Time. It isn’t based on how many people click on the video. It’s based on how long people watch the video AFTER they click on the thumbnail. So in a way this A/B testing tells you how accurate your thumbnail is. Does it tell people what the video is really about? Therefore, when they click on it, and the video matches their expectations, then they watch it longer. I guess that’s the idea.
I don’t normally do these A/B tests, because the results for me are always the same. Each thumbnails always gets around 33% of watch time. So they are all pretty much identical and it makes no difference which one I use. Of course, in terms of the visuals, these three thumbnails are not that different. They all kind of look the same if you squint. The results might have been different if I included a thumbnail that showed my giant face superimposed on top of an image of Ipoh.